In more than a decade of posts on the Climate.gov ENSO Blog, few were more popular than the ones about how El Niño and La Niña (the warm and cool phases of the natural climate pattern nicknamed “ENSO”) affect snow across the United States. Given that it’s getting to be the snowy time of the year, and La Niña conditions appear to be likely for the coming winter, we decided to reach back into the archives and dust off our maps showing how past La Niñas affected snow across North America, including Alaska, Canada, and the contiguous United States.
First things first: dealing with long-term trends in snow
Before we show you the maps, there are a couple important things to understand about them. First, they are not based on ground-based snow observations. They are based on reanalysis data, which is a dataset generated by running observations through a weather or climate model to fill in gaps in space or time. The model predicts snowfall—how much snow the atmosphere generated—not snow accumulations on the ground.
The second important thing you should know is that according to these data, average snowfall during January-March has declined across most of the United States. This long-term trend has been subtracted from the data so that the maps isolate the influence of La Niña. In a sense, the maps are a kind of hypothetical, showing what the snow patterns would have been during past La Niñas if it weren’t for long-term trends interfering. Unfortunately for snow lovers, the long-term trend across most of the United States would be working against any tendency of La Niña to bring a snowier-than-average winter.
The classic La Niña snow pattern: surpluses to the north, shortfalls to the south
With those data details explained, let’s bring in the maps. Since 1959, the tropical Pacific has experienced 22 La Niña winters. For an ENSO blog post from last year, NOAA’s Michelle L’Heureux shoveled through decades of data to make maps of January–March snowfall for each of those winters. She removed the long-term trend, then mapped where snowfall was above or below average. Finally, she merged those individual winter anomalies into a single map by averaging them together. Here’s what that “mega-average” map (the average of 22 winter snow anomalies) looks like.
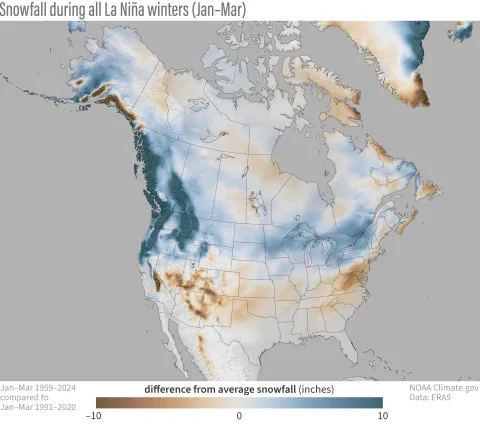
The snowfall anomalies during past La Niñas are bigger on the western side of North America than the eastern side; the darkest blues and browns are found on the south-central coast of Alaska, western Canada, the Pacific Northwest, and California. Farther “downstream,” La Niña’s influence is weaker (lighter blues and browns).
The other obvious pattern is the north-south split in La Niña’s influence across the contiguous United States. On average, La Niña favored snowier-than-average winters across the northern tier of the country, including the Pacific Northwest, the Northern Rockies, the Northern Plains, and the area around and downwind of the Great Lakes. In contrast, past La Niñas favored lower-than-average snowfall across the southern tier of the country, from the mountain ranges of the Southwest to the central and southern Appalachians in the East.
How reliable is La Niña’s influence on snowfall?
ENSO is the single biggest natural influence on average winter temperature and precipitation across the United States, but it is never the only influence. Changes in the shape, strength, and location of the stratospheric polar vortex can affect wintry weather in the United Sates. So can natural variability in the North Atlantic Oscillation, the Arctic Oscillation, and the Pacific-North America pattern.
Any of those influences could amplify or weaken La Niña’s influence, which means we can’t expect the snowfall patterns in every La Niña winter to look exactly like the ones on the map above. So another useful question to ask the data is how reliable La Niña’s influence is. In other words, how often did a given La Niña winter produce a pattern like the one in the map above? That’s what the map below shows.
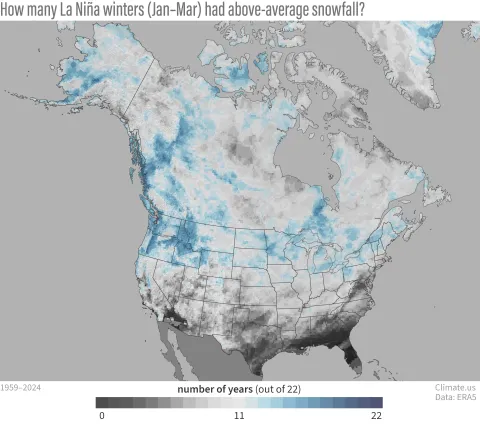
The overall patterns are similar to the average snow anomaly map but not as sharp, which is what you’d expect. Averaging smooths out details. Individual winters are never going to match the patterns from a multi-year average perfectly. But you can see that La Niña casts a reliably snowy influence in both southeastern and southwestern Alaska, the Pacific Northwest, and the Northern Rockies. The influence is weaker in the Northern Plains, Great Lakes, and interior Northeast, but still, more than half of the time, La Niña brought a snowy influence to those locations. In contrast, La Niña brought the Mid-Atlantic region more winters with below-average snowfall than above-average ones.
The light gray across much of the U.S.’ midsection—the central Great Plains, the Ohio Valley, and the central and southern parts of the Appalachian Mountains in West Virginia, Virginia, Tennessee, and North Carolina—indicates La Niña doesn’t have a strong influence on January-March snowfall there. La Niña winters were about as likely to have above-average snowfall as below-average snowfall.
La Niña and the jet stream across the United States
La Niña affects winter climate in the United States by disrupting the normal atmospheric circulation over the Pacific Ocean, which shifts the path of the mid-latitude jet streams that steer storms across North America. You can read more about ENSO and the jet stream this post from 2016, or this one from 2017, or this one from 2022, or this one from 2023.
NOAA doesn’t issue seasonal forecasts for snow, but you can check out the Climate Prediction Center’s latest outlooks for winter temperature and precipitation at their website.
